From time to time you need to analyse packets on a particular server. Usually people start by capturing packets with tcpdump and then use wireshark for the analysis.
The other day I had to debug ElasticSearch communications between nodes in a cluster. Capturing the traffic to a file, copying the file to my machine and opening the file in wireshark is a boring repetative task. So I googled if I could somehow capture it straight to wireshark running on my local machine.
The answer is, of course you can 😄
You can even do it with a handy one-liner:
NOTE: This command assumes that you have the rights to escalate your privileges to
rooton the server.
NOTE: In my case I need to run
wiresharkasroot, so I run it withsudo. This might not be the case for you.
$ ssh my-server "sudo tcpdump -s 0 -U -w - -i ens3 port 9300" | sudo wireshark -k -i -
Now these are a lot of command flags, so lets try to break them down:
tcpdump-s 0: Set the snapshot length to0, that basically sets it to the default of262144. Im not sure what it should be in this case, but the capture seemed to work fine with it set like this.-U -w -: Write each packet tostdoutas soon as its captured rather than to write only when the output buffer fills up.-i ens3: Listen to interfaceens3. This will be different for you, and-i anycan be used to listen on all interfaces.port 9300: Only capture packets on port9300.
wireshark-k: Start capturing immediately.-i -: Capture packets comming onstdin.
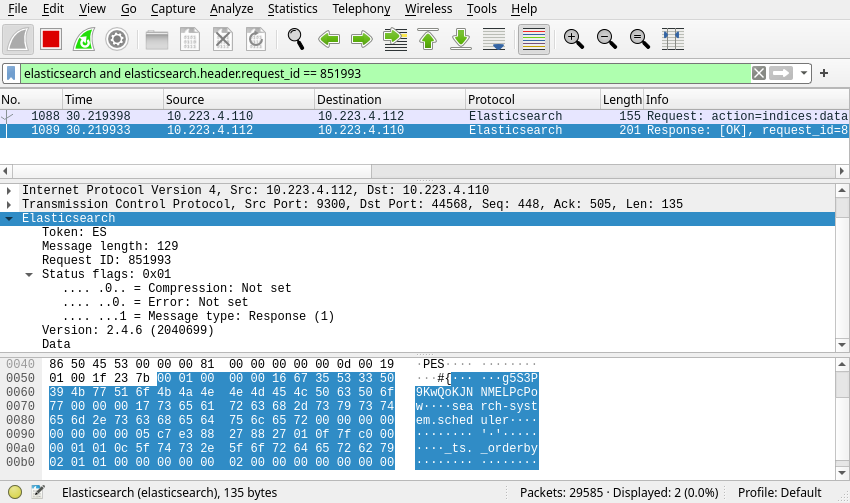
This wonderful command made the debug session a lot simpler. And of course wireshark understands the ElasticSearch protocol so you can easily see what is going on.